Visualizing Climate Change Data
Visit the Brookline Village Library Teen Room to see the vivid and beautiful art combining science data and visual media to show the effects of climate change. There are pieces hanging on the walls in the Teen Room as well as just outside near our display case and table.
Heath School Science Teacher Mark Golder explains the process of creating these works:
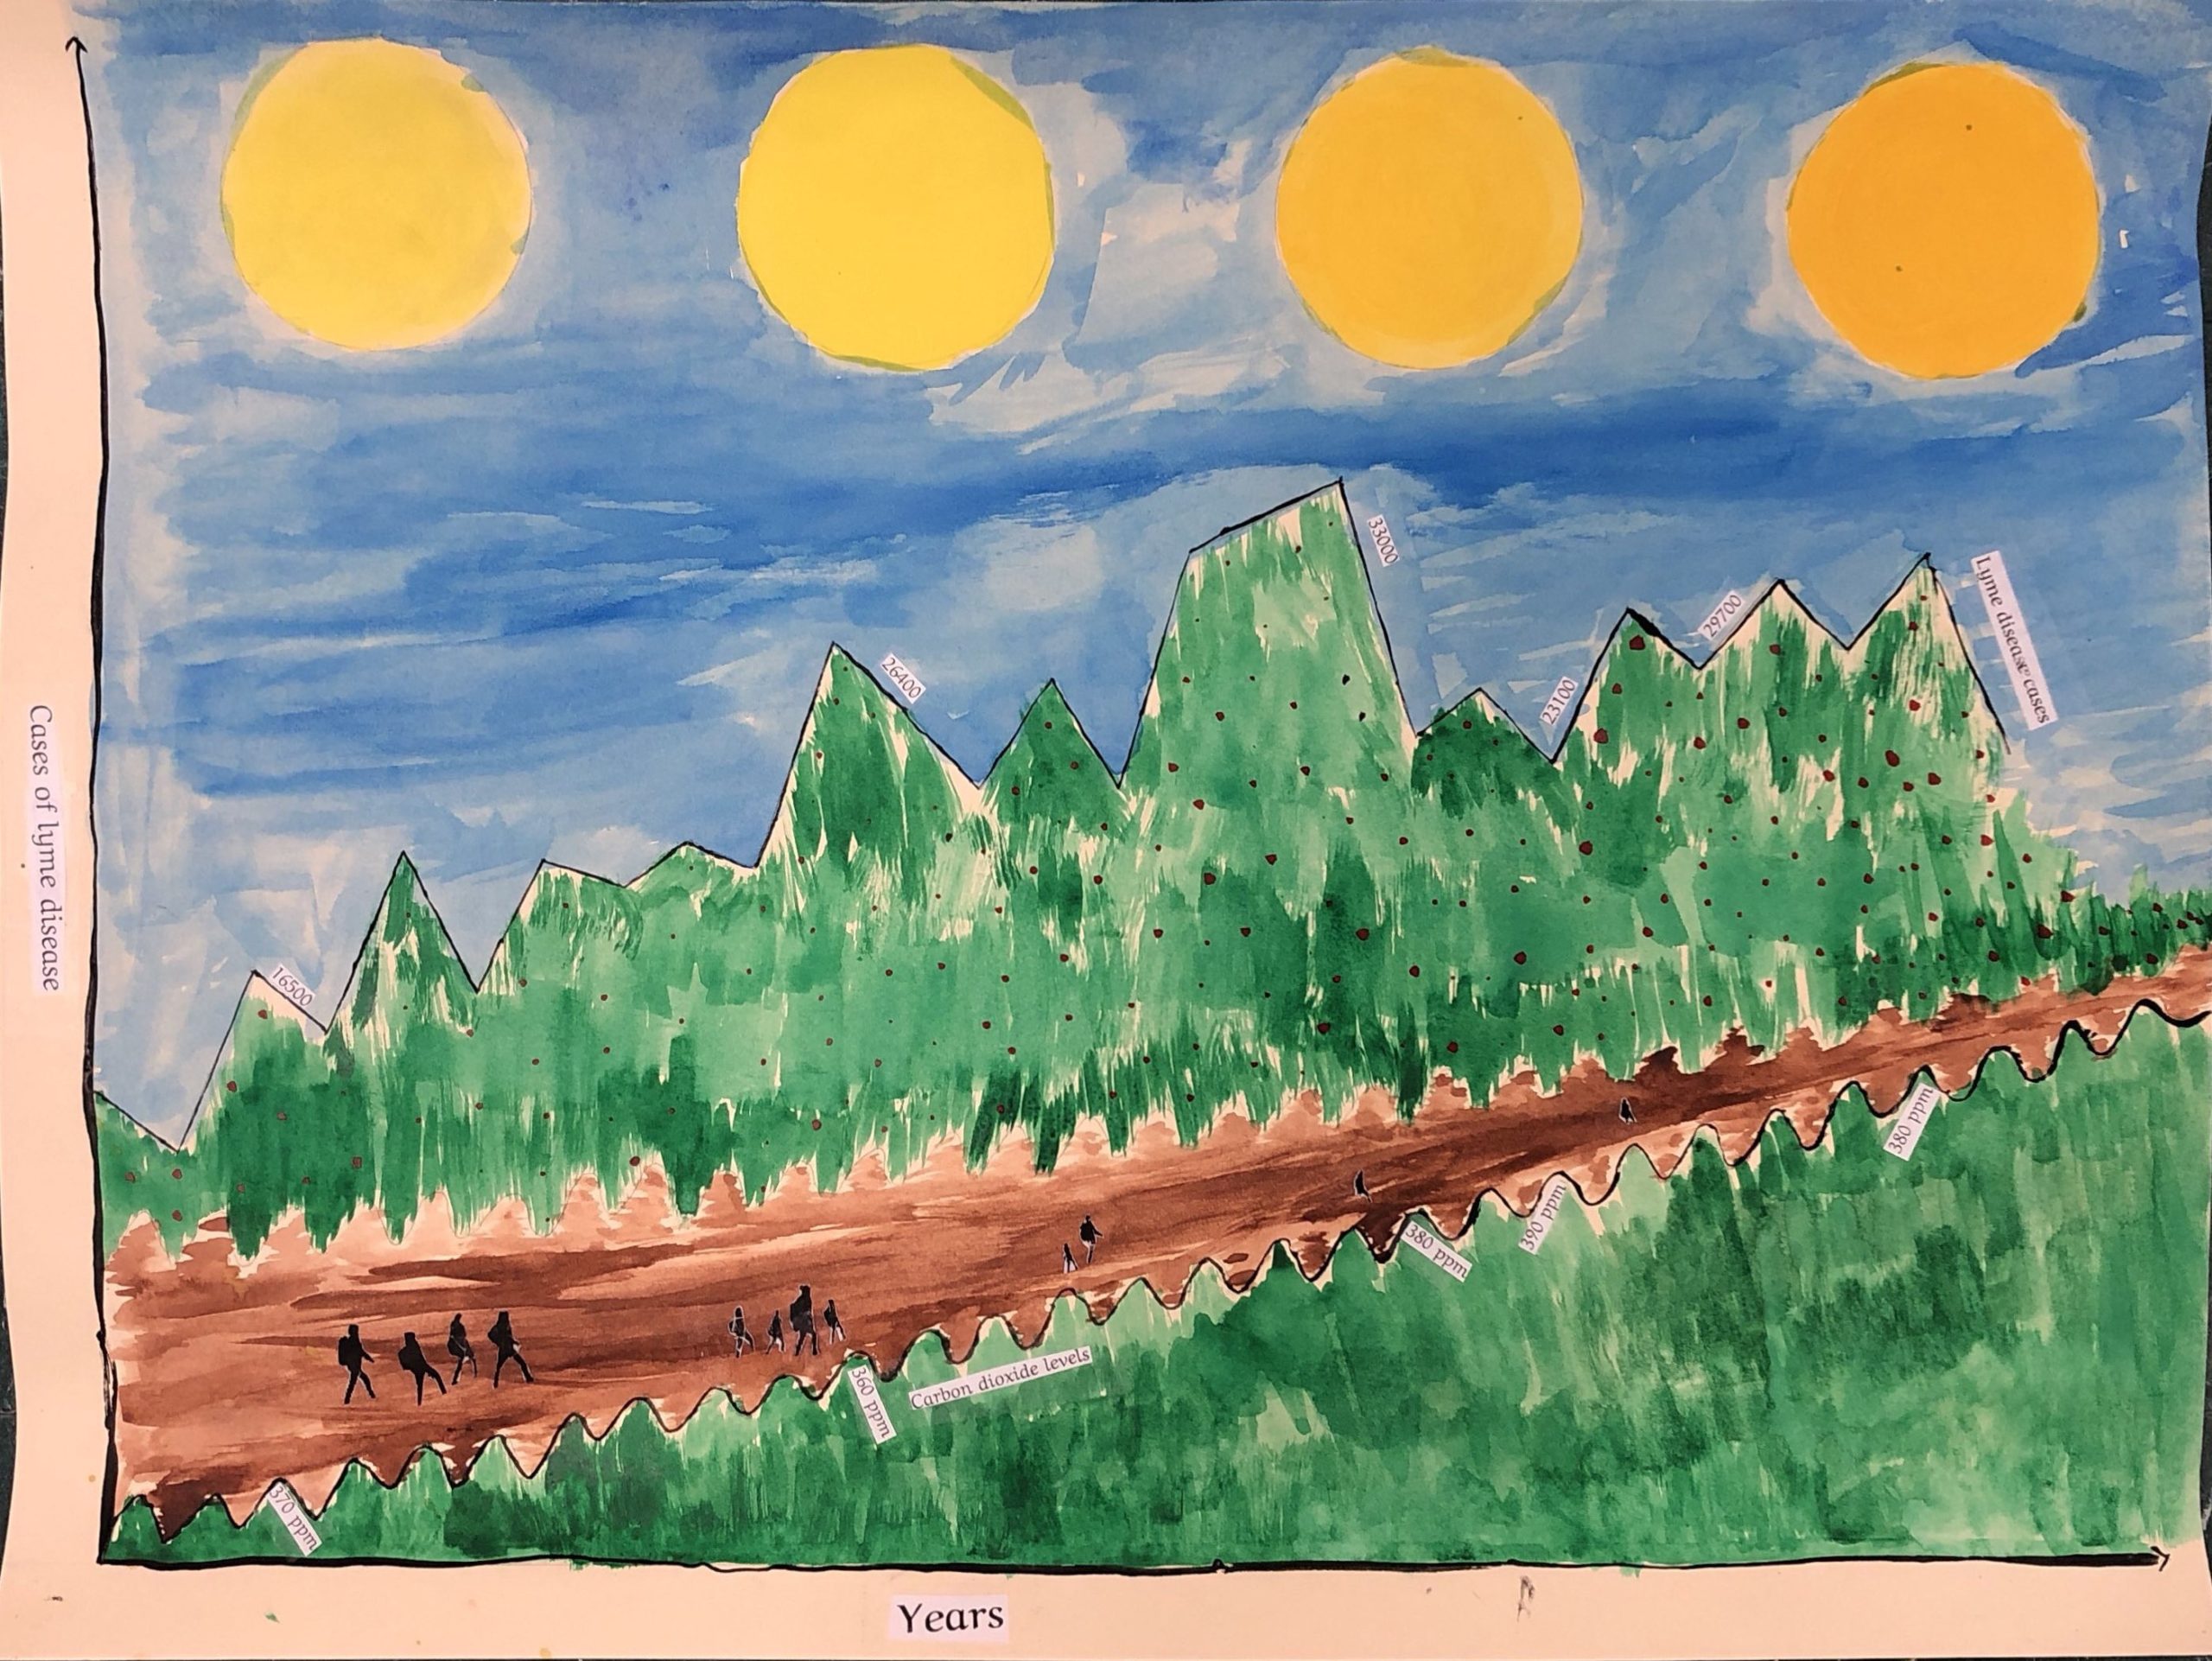
“Inspired by the work of scientist and artist Jill Pelto, 8th graders at the Heath School analyzed climate data and used this data to create pieces of art. Each piece represents one effect of climate change, and students incorporated graphs of data from that topic into their imagery.
“At the end of the project, students reflected on the process and recorded short screencasts, which you can watch by pointing your phone at the QR code on each artist statement. You can also go directly to the website with all of the student work and reflections at bit.ly/heathclimateart.
“I am incredibly proud of these students, who used their knowledge about this challenging crisis and their creativity to help inform others and inspire action.”
Here are a few more examples, but please drop by to see all 21 masterpieces!
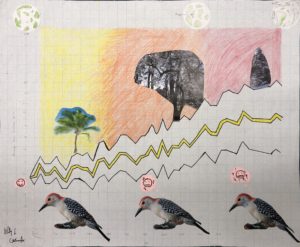
Changes in Bird Migration by Georgios and Wally
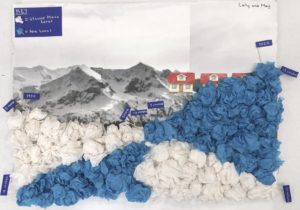
Loss of Glacier Ice: Project by Cally and May